- Topics›
- U.S. housing market›
Home Price
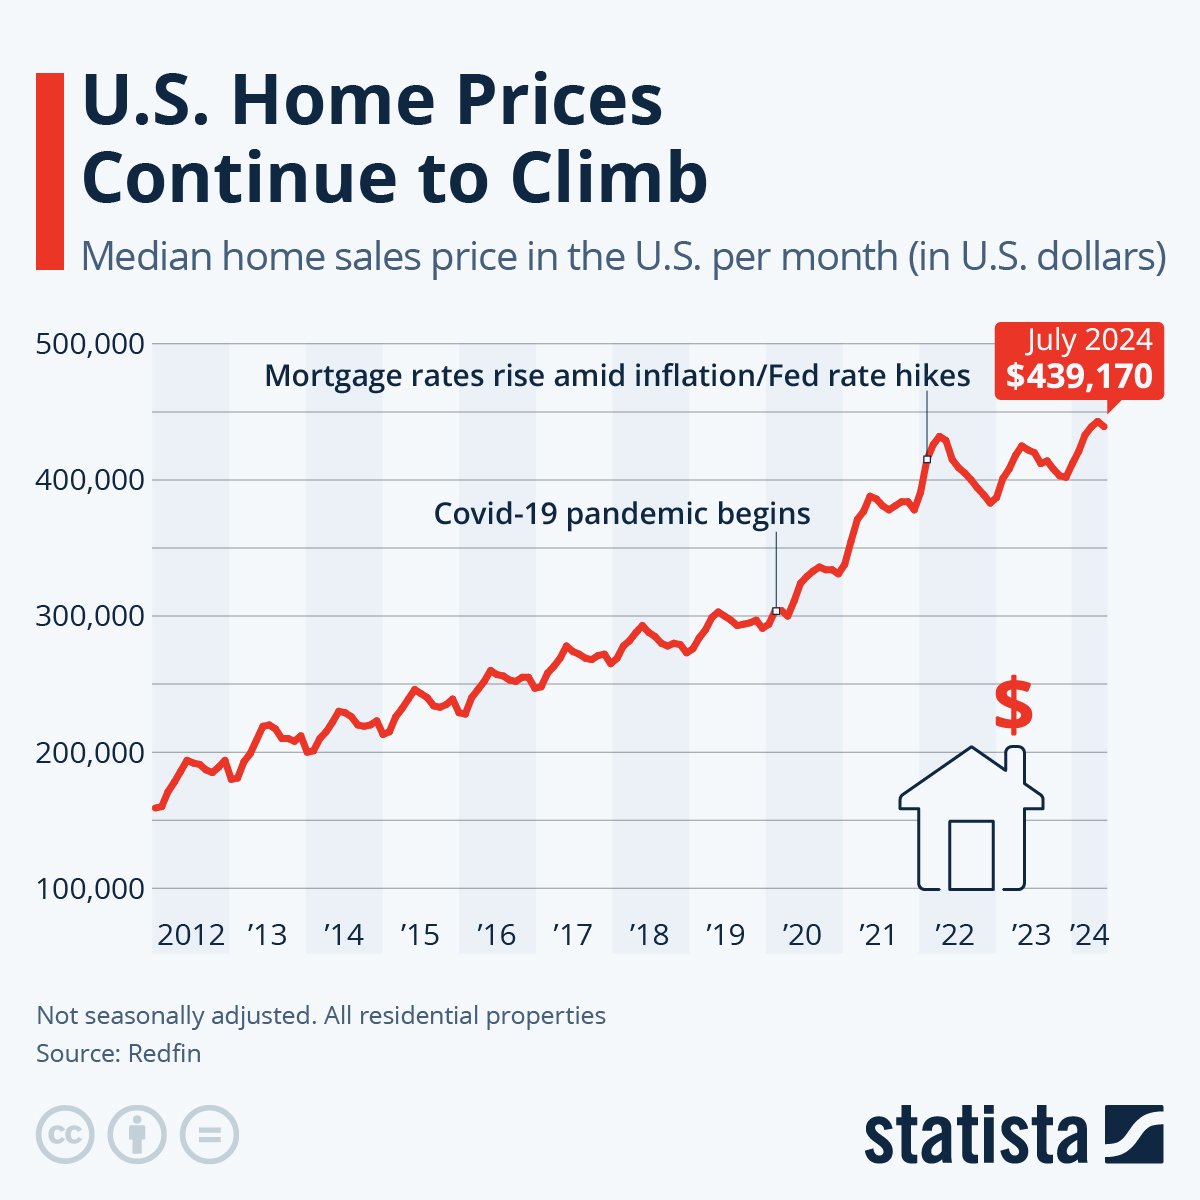
Throughout the crises of recent years, U.S. home prices have continued to climb. While the coronavirus pandemic and the advent of remote work saw demand and costs skyrocket, runaway inflation and Fed hikes caused mortgage rates to rise and slowed price increases somewhat. However, in July of 2024, Redfin estimated the median U.S. home price at $439,170. This is less than June's record of $442,479, but still more than when the market first moderated after the substantial Fed rate hikes (around $432,000 in May 2022).
Between May of 2022 and March of 2020 - when the coronavirus pandemic began - the median U.S. home price increased by 42 percent, up from $304,000, when not adjusting for inflation.
U.S. home sales used follow a cyclical pattern, with most demand and higher prices in summer and less demand an lower prices in winter. However, this dynamic has been somewhat upset since 2020. Since then, home prices have risen much more in-season than they have fallen off-season while the supply of homes for sale became more and more scarce. According to Marketwatch, the pandemic housing market actually collided with other, longer-term developments that were already putting pressure on the U.S. home market and its housing supply. Mortgage rates that were once again rising slightly were causing more Americans to stay put rather than move. Also, homeowners are older now than they used to be, but are more likely to "age in place" instead of downgrading, snowbirding or moving into retirement communities. The average time between moves had already reached a high of 13.5 years in 2020, increasing from just around ten years in 2012, and only started to fall again in 2021 as the pandemic prompted more moving activity.

Katharina Buchholz
Data Journalist
katharina.buchholz@statista.com


Description
This chart shows the median home sales price in the U.S. per month (in U.S. dollars).
Report
Infographic Newsletter
Statista offers daily infographics about trending topics, covering:Economy & Finance, Politics & Society, Tech & Media, Health & Environment, Consumer, Sports and many more.
Related Infographics
FAQ
The Statista "Chart of the Day", made available under the Creative Commons License CC BY-ND 3.0, may be used and displayed without charge by all commercial and non-commercial websites. Use is, however, only permitted with proper attribution to Statista. When publishing one of these graphics, please include a backlink to the respective infographic URL. More Information
The Statista "Chart of the Day" currently focuses on two sectors: "Media and Technology", updated daily and featuring the latest statistics from the media, internet, telecommunications and consumer electronics industries; and "Economy and Society", which current data from the United States and around the world relating to economic and political issues as well as sports and entertainment.
For individual content and infographics in your Corporate Design, please visit our agency website www.statista.design
Any more questions?
Get in touch with us quickly and easily.
We are happy tohelp!
Do you still have questions?
Feel free to contact us anytime using our contact form or visit our FAQ page.
Your contact to the Infographics Newsroom

Felix Richter
Data Journalist
felix.richter@statista.com +49 (40) 284 841 557

Statista Content & Design
Need infographics, animated videos, presentations, data research or social media charts?
The Statista Infographic Newsletter
Receive a new up-to-date issue every day for free

- Our infographics team prepares current information in a clear and understandable format
- Relevant facts covering media, economy, e-commerce, and FMCG topics
- Use our newsletter overview to manage the topics that you have subscribed to
